-3.png)
What’s the Cook and his Residuals got to do with ETFs?
- Tian Khean Ng
- Dec 12, 2024
- 3 min read

Linear Regression, Cook’s Distance and Residuals

Today’s Learning Corner article is about two statistical measures used in Linear Regression. Linear Regression is more useful than you may think, even for non-linear time series financial markets data. It can help establish the statistical confidence level of your model and pinpoint the data points that significantly influence the model.
Cook’s Distance
Cook's Distance is named after R. Dennis Cook, an influential American statistician who introduced this metric in 1977. It is a commonly used metric in regression analysis that helps identify influential data points—observations that have a disproportionate effect on the overall regression model. Its purpose is to quantify how much each individual data point affects the fitted values in a regression analysis. Cook's Distance essentially combines two concepts: leverage and residuals. Leverage measures how far an individual observation is from the mean of the independent variables, while residuals represent the difference between the observed and predicted values.
We use the Simplify Volatility Premium (SVOL) ETF by https://www.simplify.us/ to illustrate the use and interpretation of Cook’s Distance and Residuals. SVOL seeks to generate returns from the inverse performance of the CBOE Volatility Index (VIX) short-term futures index while also mitigating extreme volatility with Treasuries and USD. It is an interesting ETF to watch now as Middle East, Ukraine, and the South-China Sea geopolitics churn volatility in the financial markets. As this study is just for learning purpose, we do not partition the data set into Training, Validation and Testing subsets as would normally be done for prediction models.
Chart 1 below shows the Cook’s Distance numbers from a multivariate Linear regression done on 192 data points of SVOL. It has been converted to Natural Logarithm to make visualization easier. Here you can identify the large downward spikes and the dates on which they occur. These dates have a high level of influence on your model and need further investigation.
Chart 1

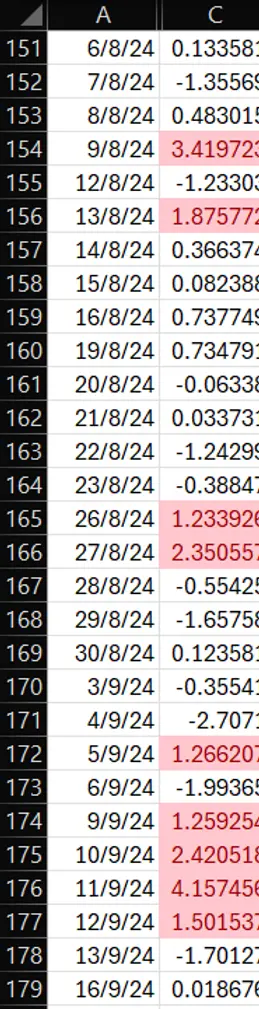
Table 1 below shows that there are more clusters of above-average spikes recently. A sign of impending increase in volatility?
Residuals
In Statistics, Residuals are the difference between Predicted and Actual or between Original and Fitted series of data. They are important for checking whether your model stands up to scrutiny. A good model should have residuals in the shape of a Normal Distribution.
Chart 3 below is a chart of the Residuals. It shows that the +/- Residuals are getting bigger in the latter part of the study (the more recent dates). This confirms what was observed in the Cooks Distance numbers.

You can see this more clearly in Chart 3 scatter plot below. The Residuals have been Studentized i.e. discounted for leverage. (probably so called because of Student’s T test, another Statistical measure innovated by the very humble English Statistician William Sealy Gosset who used ‘Student’ as his pen name when publishing academic papers)

To top off this study, lets have a look at SVOL’s performance (% Return) on Chart 5 below. Here you can see that 1-month Return % is negative. Does this again foresee an impending increase in volatility? But of course, SVOL will soon execute hedging and re-allocation of holdings to turn around is performance just like they have always done in the past to achieve their objective of giving investors stable and better returns in the low yield environment which has just descended upon us with the beginning of the Fed’s interest rate cuts on 18 September.

Conclusion
While we may find Linear Regression useful, we should note that it may oversimplify (in technical terms Underfit) very noisy financial markets data.


Comments